
Every quarter we put Cosmos through a multi-day performance test: real machines, four browsers plus our desktop apps, and a fleet of 150 bots simulating a busy distributed company. The full method is in how we keep Cosmos light at any call size.
The July 2026 run is done, and the biggest result is this:
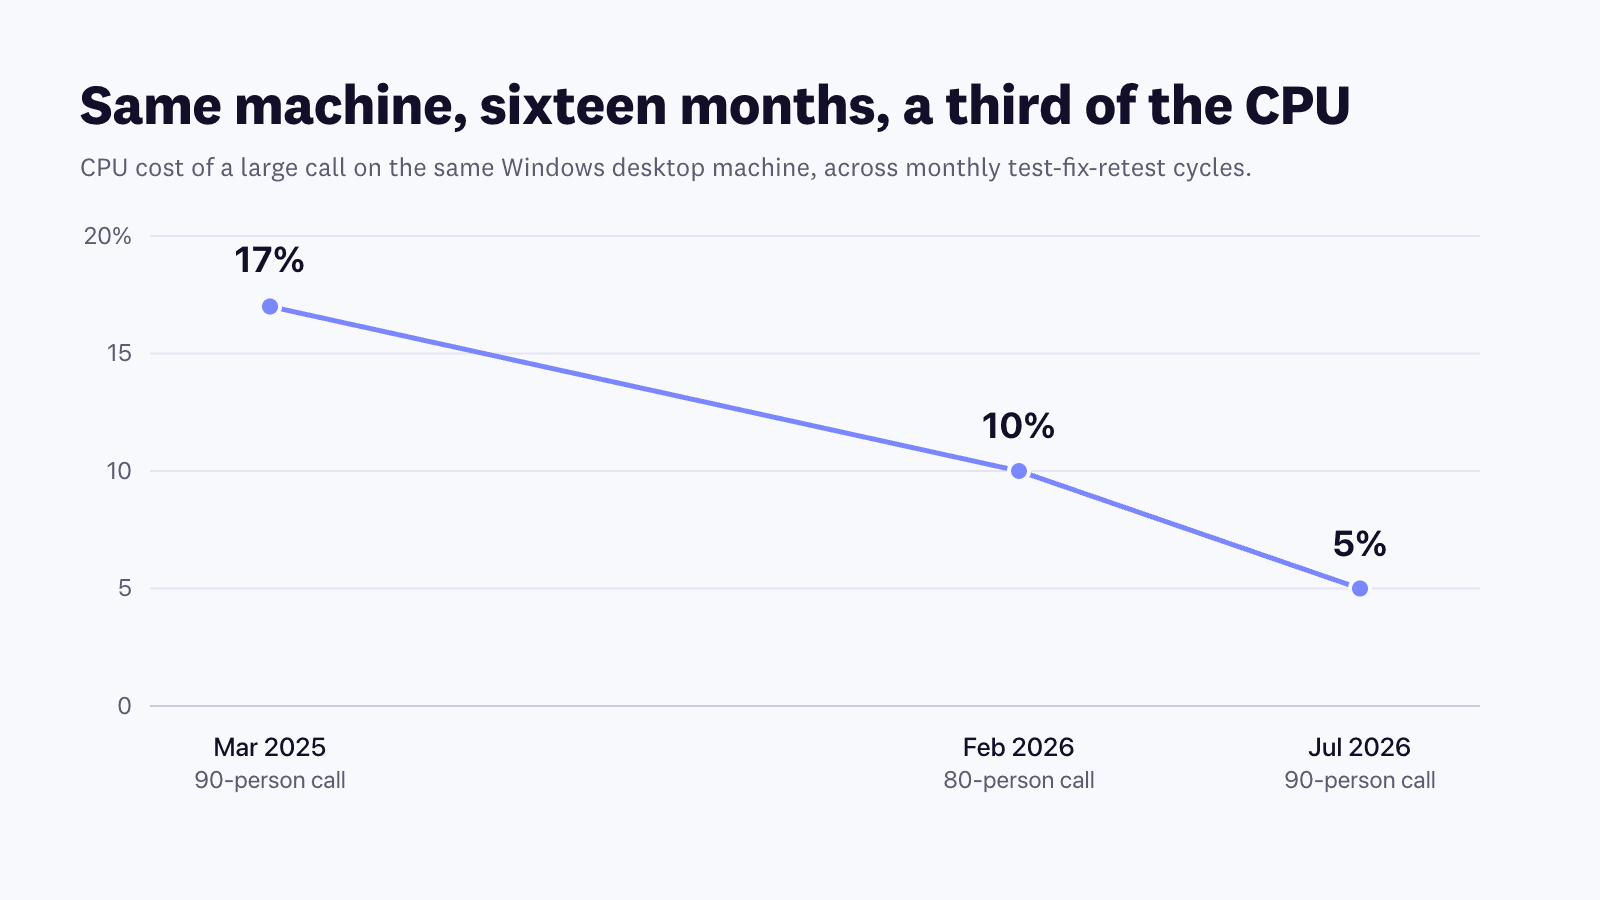
- The same call now costs a third of the CPU it did sixteen months ago.
- A 90-person call costs your machine the same as a 20-person one, a 5-person Cosmos call is lighter than the same call on Google Meet, Zoom, Microsoft Teams, Webex or Zoho Meeting.
- Running Cosmos in the background when sitting at your desk costs about 1.5% CPU.
The same call costs a third of the CPU it did sixteen months ago
We run this process on the same machines every time, so the numbers compare directly across runs:
- On the Windows desktop app, a 90-person call cost around 17% CPU in March 2025. In July 2026, the same call on the same machine cost around 5%.
- On a deliberately low-end Windows laptop with 4 GB of RAM, running Cosmos in Edge, a mid-sized call cost around 71% CPU in March 2025. In July 2026 it was around 40%.
- On a Mac in the browser, the same scenario went from around 50% CPU to around 23%.
A note on Mac numbers throughout this post: macOS reports CPU as a percentage of a single thread, not of the whole machine. A reading of 30% there means a third of one thread on a many-threaded machine, so the machine-wide usage is far lower than the raw figure suggests.
None of that came from one clever rewrite. It came from repeated test-fix-retest cycles, compounding quarter after quarter.
The March 2025 results record the kind of thing this process exists to catch: a burst of animated emoji reactions pushed memory to 4.2 GB, never gave it back, and crashed the weakest machine in the fleet outright. Fixed, and verified in the next run. We wrote about an earlier chapter of this work in how Cosmos delivers high-performance virtual spaces.
A 90-person call costs your machine the same as a 20-person call
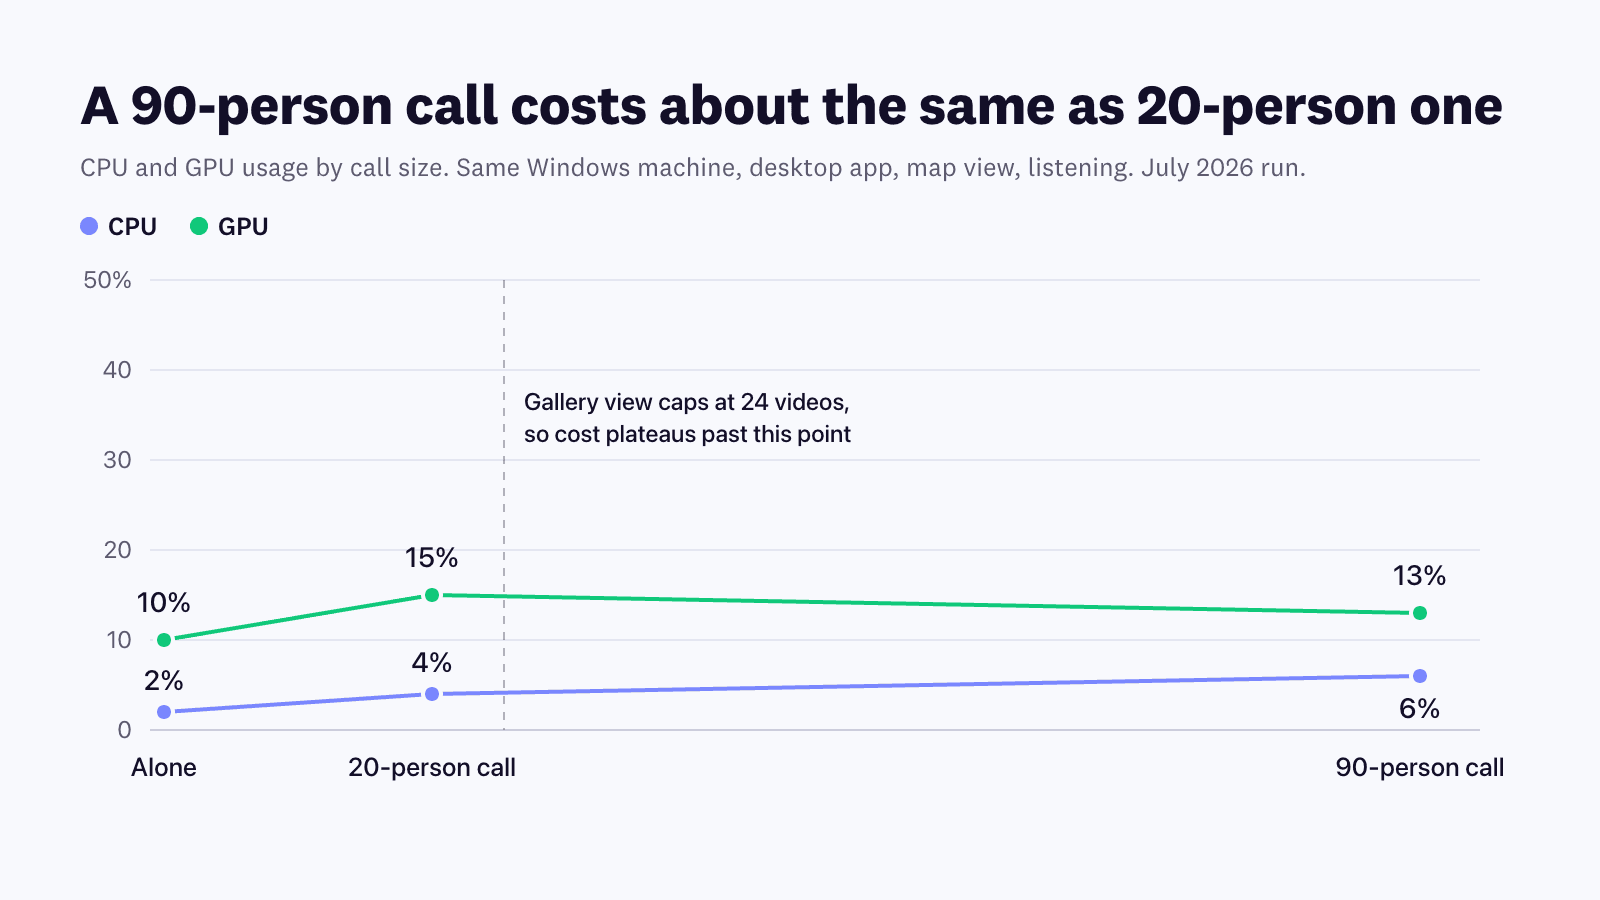
The architecture makes this possible: a call's cost is tied to the number of video tiles on your screen, not the number of people in the room. Gallery view shows up to 24 videos at once at our test setting (you can set it to 12, 24 or 36); everyone beyond the cap sits on the next page, and your machine only ever renders what is on screen. So resource usage climbs up to the gallery cap and then flattens, no matter how large the call gets.
Every run has to prove that promise again, and July did. On the Windows desktop app in map view, listening:
| Call size | CPU | GPU |
|---|---|---|
| 20 people | ~4% | ~15% |
| 90 people | ~6% | ~13% |
Four and a half times the participants, and the machine barely notices. That is why a 90-person all-hands does not need a special laptop.
A 5-person Cosmos call costs your machine less than Meet, Zoom, Teams, Webex or Zoho
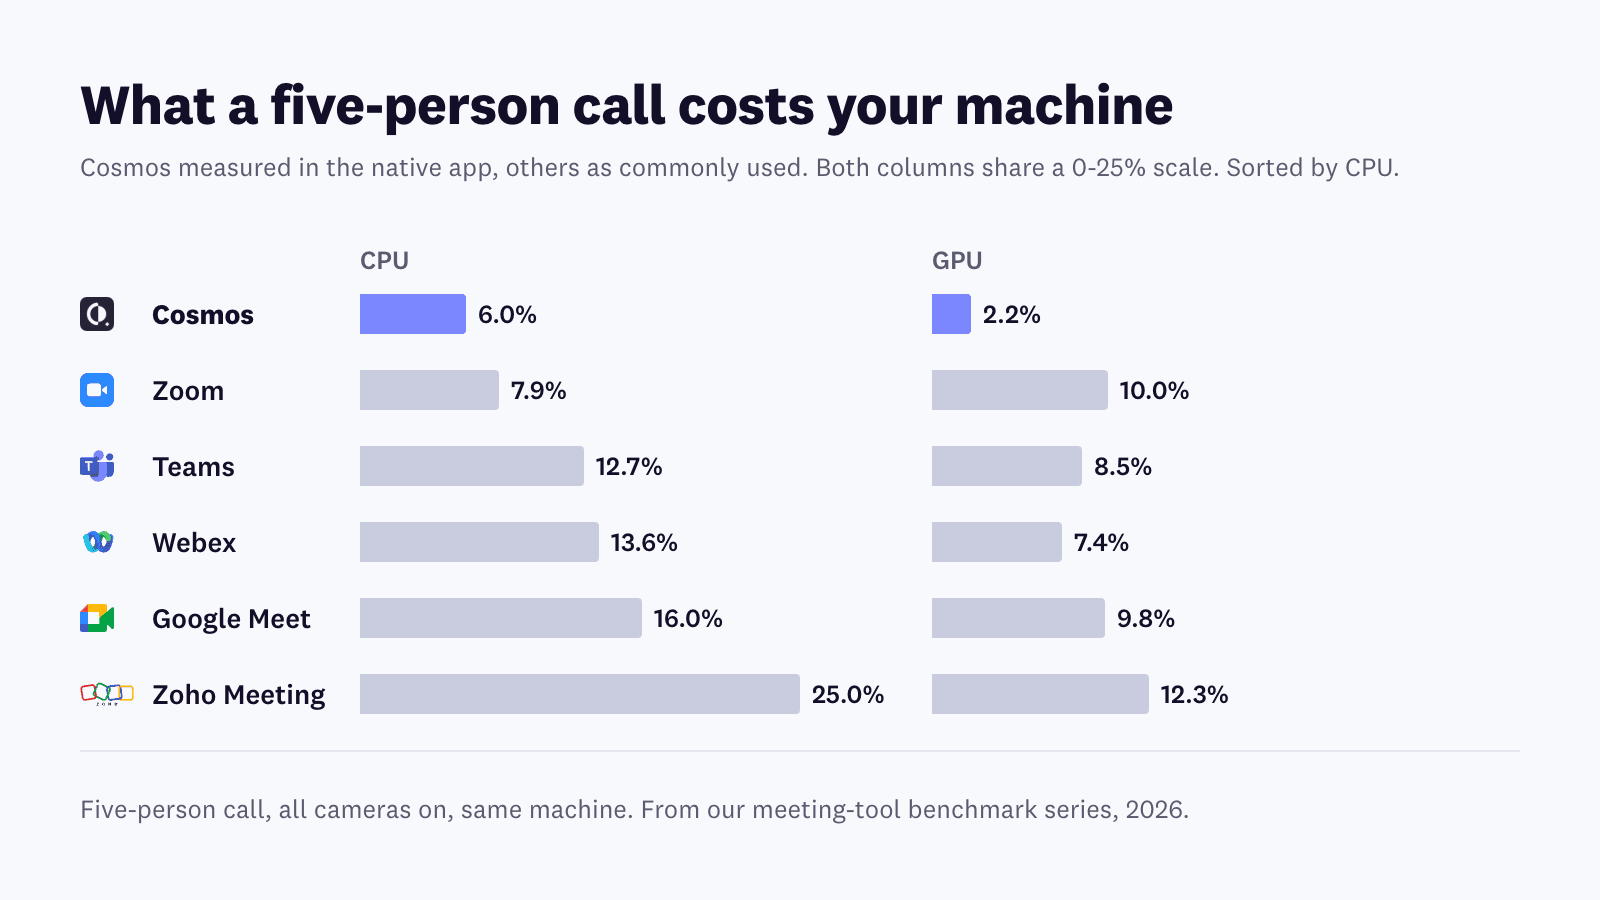
That is a measurement, not a marketing line. Earlier this year we benchmarked the same 5-person call, all cameras on, on the same machine, against Google Meet, Zoom, Microsoft Teams, Webex and Zoho Meeting. Cosmos used the least CPU and the least GPU of all six tools.
Sitting in Cosmos all day costs about 1.5% CPU
Presence is the state you spend most of your working day in, which makes it the most important number in this post. Being in your virtual office, connected, visible to your team and ready to talk, costs almost nothing. On the Windows desktop app in July:
- Call view, listening: around 1.5% CPU, 0% GPU, roughly 910 MB of memory
- Call view, mic and camera on: around 3% CPU, 17% GPU, roughly 940 MB
- Map view, listening: around 2% CPU, 10% GPU, roughly 560 MB
In the browser the story is similar. Edge on Windows idled at about 5% CPU in call view and 12% in map view. Chrome on a Mac read about 15% CPU in call view listening, 22% in map view, and 16% with mic and camera on, with roughly 520 MB of memory throughout (single-thread readings, per the Mac note above).
How we achieved it: six memory leaks found, fixed and verified
Snapshots were the easy part. The harder question is what happens over hours of use, so we repeat everyday actions 5, 10 and 30 times and watch whether memory returns to its baseline. In July, in six actions, it did not:
- switching status between Focus and Available
- switching camera devices
- starting a screenshare, and watching someone else's
- toggling noise cancellation
- broadcasting
- switching pages in gallery view
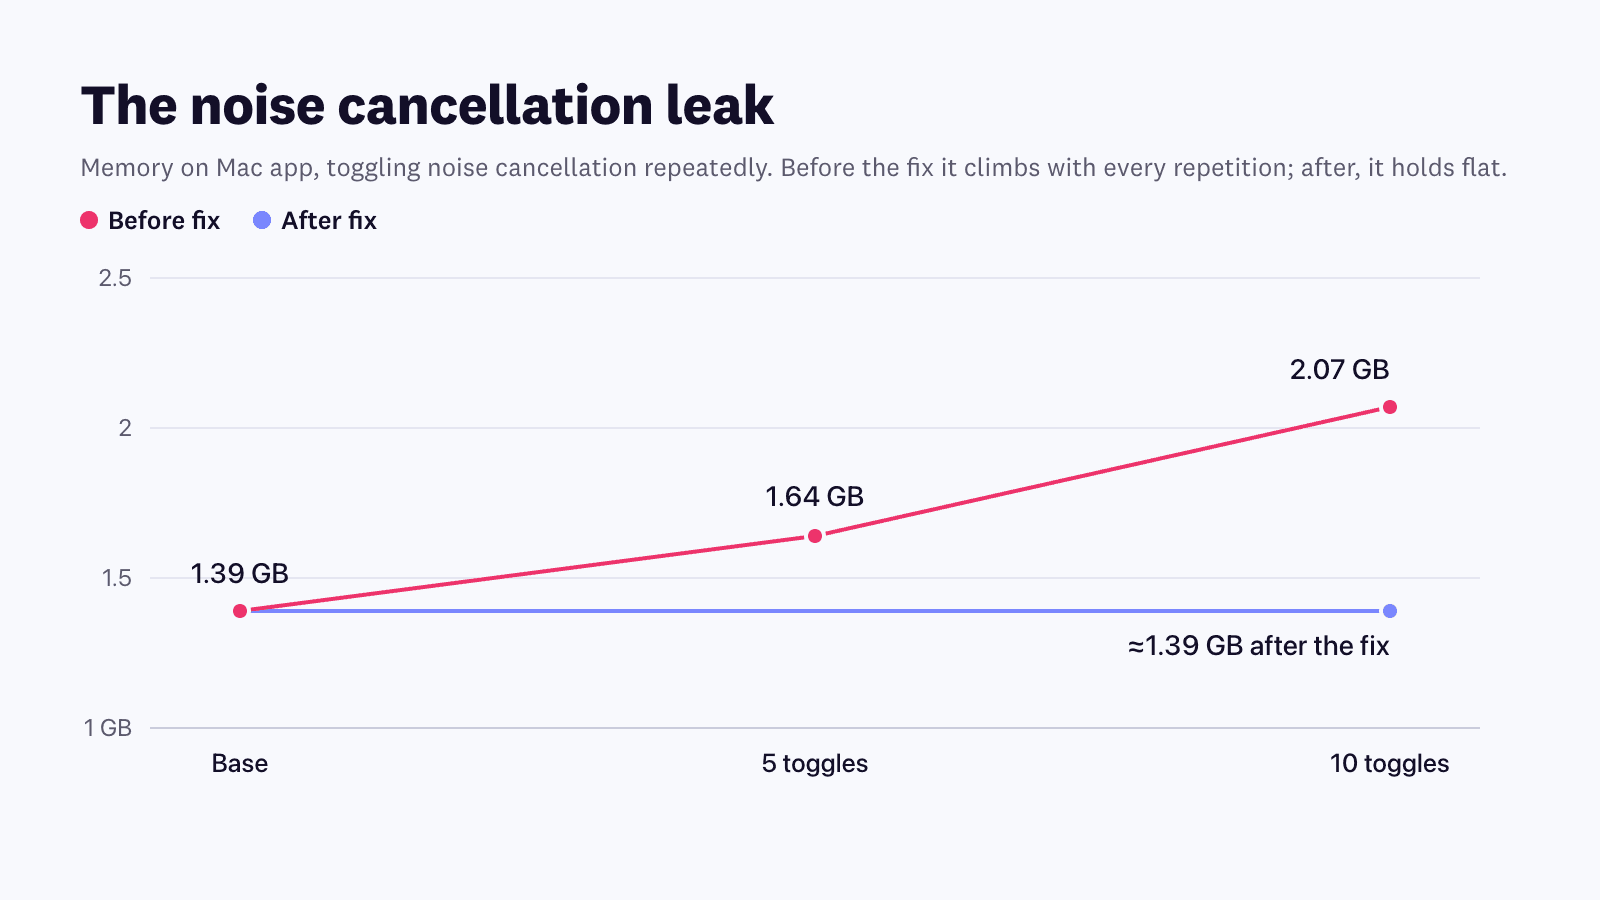
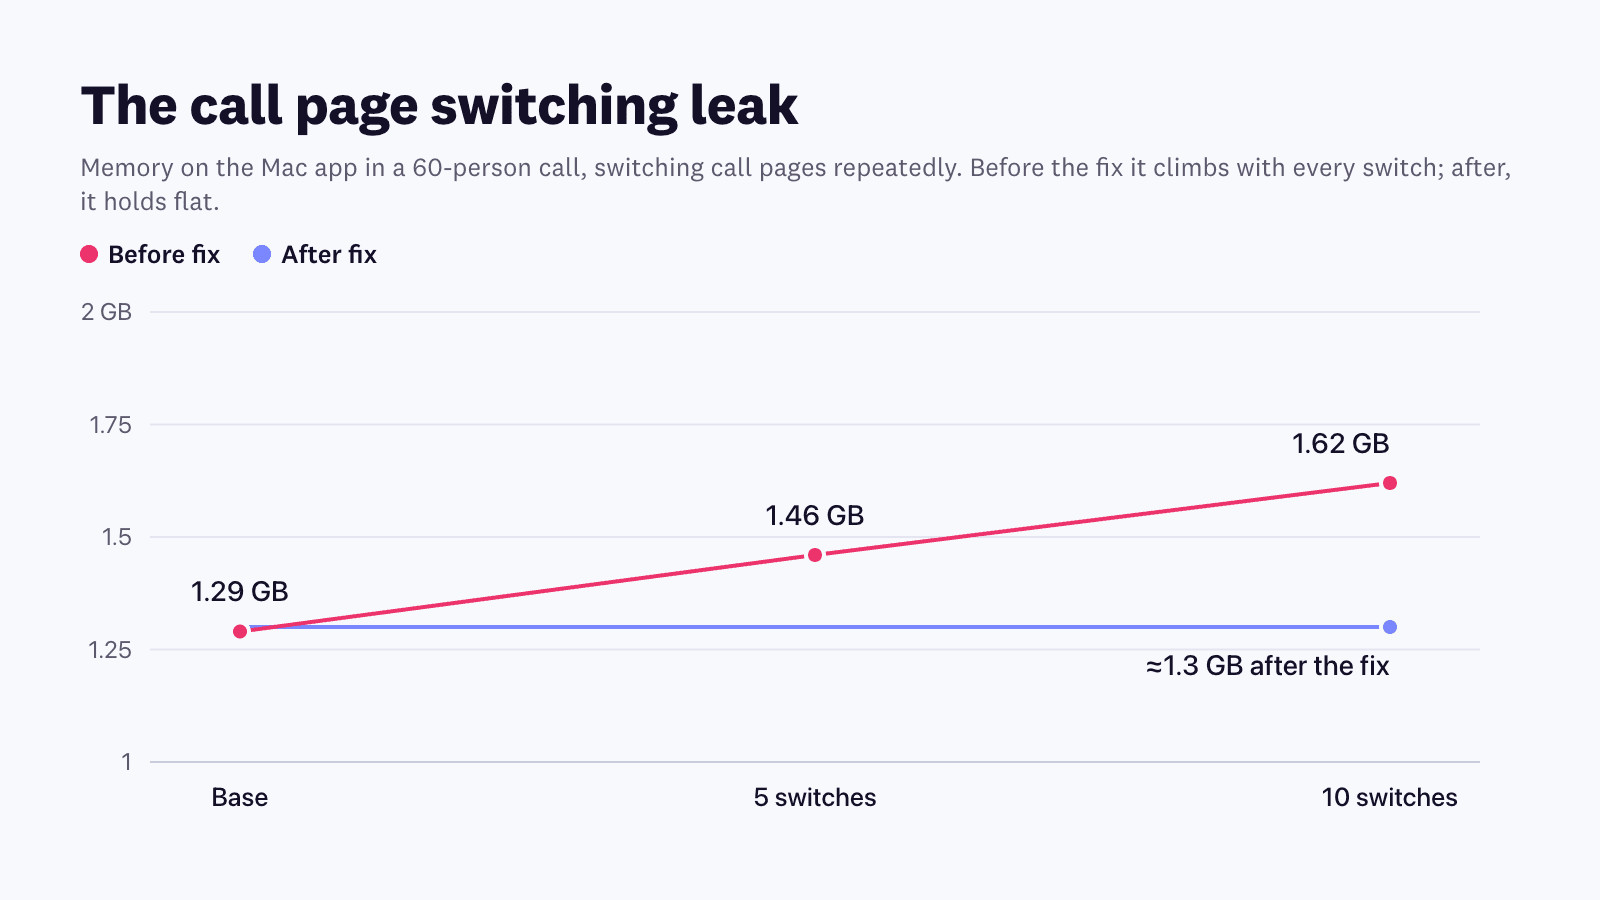
Noise cancellation on the Mac app shows the shape of the problem. Picture a session idling at 1.39 GB of memory. Before the fix, five toggles added roughly 0.25 GB, taking it to about 1.64 GB; ten toggles added 0.68 GB, pushing it past the 2 GB mark, and none of it was released afterwards. Nobody toggles noise cancellation ten times in a row, but a leak like this grows quietly across a working week of normal use. Call page switching showed the same shape: in a 60-person call, the session sat at roughly 1.3 GB, and ten page flips took it to 1.62 GB with none of it coming back.
Every leak on the list was fixed during the same test cycle, and each fix was verified by re-running the identical scenario on multiple machines with the bot fleet. The noise cancellation re-test tells the story in one line: that same session now ends exactly where it began. Ten toggles later, memory still reads 1.39 GB. Call page switching holds at 1.3 GB however many pages you flip. The rest were confirmed the same way: repeat the action, watch the line stay flat.
The run surfaced functionality and UI issues too, and those were fixed alongside:
- a camera feed appearing stuck when switching to a second camera before its permission was granted
- broadcasters not seeing their own video in the popout or in chat view
- the input volume slider not working on Firefox
- polish on whispering, broadcast and meeting room toast positions
Your Cosmos got lighter
Every fix from the July run is already live. You did not have to update anything or ask for it; your Cosmos simply got lighter.
So leave Cosmos open from your first coffee to the end of the day, sit in a 90-person all-hands, toggle whatever you like, and your machine will barely notice. That is performance and reliability at work.
Ready to try Cosmos Video?
See how a persistent virtual office changes the way your team works. Free for up to 4 concurrent users — no credit card, no time limits.
Tags
- performance test results
- video call cpu usage
- memory leak
- virtual office performance
Stay in the loop
Get the latest articles in your inbox. No spam, unsubscribe anytime.
.png&w=3840&q=75)